VocApp-Browse/ValSetView
Contents
Browsing Value Sets
At present (September 2007), the editor offers two different panes for browsing value sets -- a tree view and a graph view. These panes are not linked. That is a selection in one pane does not change the state of the other.
Selecting a Value Set for Browsing
The present (September 2007) release of the tool does not provide an independent means within the value set panes to select a value set to view. The current method of initiation is to select a concept domain in the Concept Domain Tree which will cause the value set bound to that domain to be displayed in the value set panes. If the concept domain selected is the root domain for one of the HL7-defined code system, like ActClass or RoleCode the effect is to load the value set panes with all of the value sets defined on that code system.
The Va;ue Set Navigator is made up of a pair of linked panes, as seen in the figure below. The left hand pane is a tree view that displays the value set hierarchy as a branched tree (similar to the display in RoseTree) where branches may be expanded or collapsed to reveal more or less of the tree. See a later section for tips on navigating in the tree.
Whenever a node is selected in the left-hand pane, the right-hand pane is loaded with the meta data about the item, including:
What kind of object it is;Its description or definition;its Print Name (in the case of a leaf term or specializable value set) or its Value Set Name (in the case of an abstract value set name)NOTE: These two values (print name and value set name) are conflated under the tag "Coded Concept", and the value set name is not displayed for specializable domains which have both a print name and a value set name
its concept code (in the case of a leaf term or specializable value set)the name of the code system from which the values are drawnthe OID of the code system from which the values are drawn
Although the right-hand text pane currently does not have a scroll bar, its content can be scrolled by selecting as if to edit in the text, and then using the down and up arrows to scroll the text.
Whenever a node is selected in the left-hand pane, the right-hand pane is loaded with the meta data about the item, including:
- What kind of object it is;
- Its value set name (unless it is a leaf node)
- It's Code and Print Name (in parentheses) unless it is an Abstract Value Set
- Its description or definition;
- the name of the code system from which the values are drawn
- the OID of the code system from which the values are drawn
This pane is a "browser" and renders both the meta data and the contents of the description using HTML.
Changing Rendering of Description Contents
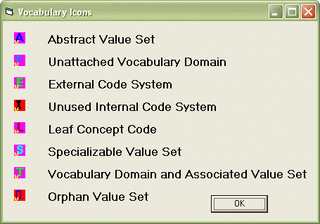
The icons used to designate different types of nodes are the same as those used in RoseTree. The legend for those icons is in the following figure.
Value Set Graph
The value set graph provides an alternate means of visualizing the hierarchical relationships among the value sets. It displays these as a branching graph laid out horizontally with the root node to the left. The initial view of this graph is shown in the figure below.
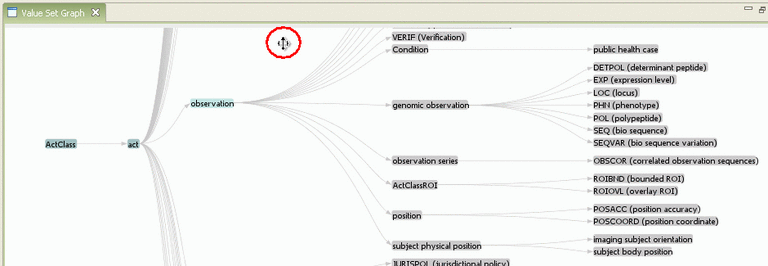
Clearly, the small pane size in the figure above limits the utility of the graph. However by maximizing the pane (using the button upper-right) one gets a larger display such as that below. In that pane, you can alter the display by:
- Click on the pane and drag it around to change the center of view. (As this is done, the cursor changes to a four-way arrow, as shown in the circle on the figure.)
- Right-click on the pane (changing the cursor to an up-down arrow) and then drag down to "zoom in" (enlarge) the graph and drag up to "zoom out" (reduce) the graph
- Click on a node to extend or reduce the depth (number of levels) of the graph. The graph control displays two levels below (to the right) of the last node selected, which was observation in the example below.


